Causal Profiling in .NET
11 Oct 2019Recently there was an interesting talk by Emery Berger on a multithreading profiling technique called causal profiling. The idea is that by slowing everything else down running concurrently with a region of code, you can infer what the effect would be of speeding up that code.
The talk covers a C++ library called Coz. This post explores if this can be done in .NET.
To achieve this, code to define the start and end of each region will have to be added to the codebase directly. This fits well with using a debug library in preference to step through debugging discussed in a previous post.
Simple implementation
There is a simpler way that could achieve the same aim. Like many physical systems there is a scale invariance in multithreaded systems. If all regions are proportionally slowed down, then the causal threading picture will not change. It is just like enlarging a photo.
So, if all regions apart from one are proportionally slowed down, and the run time is compared with a run where everything is slowed down, this virtual speed up can be deduced.
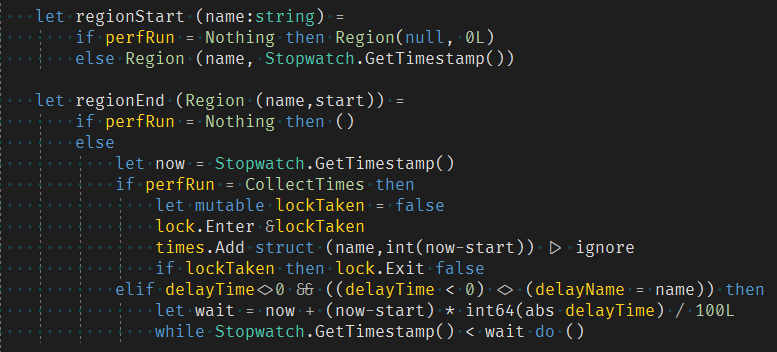
This can be implemented by simply recording the region start and end time and spinning in the end region call for a given percentage of the region time span. Spinning is necessary rather than sleeping as it needs to simulate work and not encourage a context switch.

The code can be found here.
Full implementation
The full implementation is more involved due to two main issues.
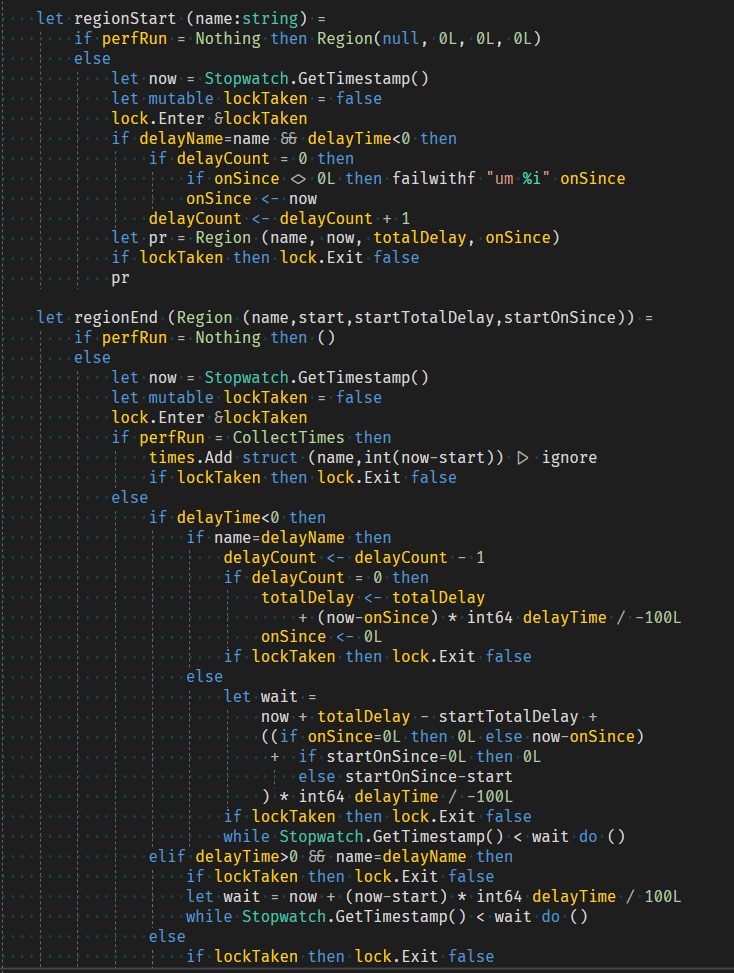
Firstly, the slow down for regions will depend on measurements of the overlap with some other region. This region may be being run on multiple threads and the slow down should not be double counted. It is the overlap with one or more.
Secondly, this interesting bookkeeping will inevitably lead to efficient locking code being needed.
Interlocked low locking will not work as there are multiple variables to track (region thread count, region on since and total delay).
This is going to need SpinLock (again to discourage a context switch) and as little code as possible.

The code can be found here.
Statistics
These measurements need to be run for an array of delay percentages for each region defined. This defines an iteration. This is then repeated, and the results are summarised after each iteration.
The summary statistics are the median and standard error after outliers are removed. Outliers are defined as measurements outside of 3 times MAD as described in a previous post.
Below is the output of the repo Fasta example:

The summary table shows:
- Region - the region name defined in
regionStart. - Count - the number of times the region code is called in each run.
- Time% - the total time in the region divided by the total elapsed time divided by the number of cores. This is only a small sample approximation.
- +n% - median and error program time % change when the region itself is slowed down by a given %.
- -n% - median and error inferred program time % change when other regions are slowed down by a given % to model a virtual speed up of this region.
Conclusion
The results for the simple and full implementation are within the error margin for the Fasta example. The full implementation due to how it is calculated has a smaller error for the same number of iterations. The full implementation is probably what will be used going forward but it is good to keep the simple version for comparison.
The talk above discusses how this technique can be extended to profile throughput and latency. This would be a simple extension to the existing implementation.
It's amazing what can be achieved with a good idea (stolen!), some statistics and less than 200 lines of code.
This technique and Expecto's isFasterThan created from a previous post
are examples of how a small amount of code can produce fast, simple and statistically robust performance tools.

